.svg)
.jpg)

Enhancing Install-Rate Prediction Models: Balancing Metrics and Offline Evaluation at DT-DSP
June 11, 2024
Introduction
Real-Time Bidding (RTB) is a fascinating aspect of digital advertising where ad impressions are bought and sold in real-time. It works much like a stock exchange, where advertisers bid for an ad impression on a website or an app.
When a user visits a site or app, contextual information about the user and the item is sent to an ad exchange, which then auctions off ad impressions to the advertiser willing to pay the highest price. The winning ad is then loaded onto the webpage, and all of this happens within milliseconds of the user visiting the site or app. The primary goal of RTB is to enable advertisers to deliver their ads to their target audience at the right time, in the right context, and at scale.
A Demand Side Platform (DSP) is a key player in the ad tech ecosystem. DSPs allow advertisers to buy ad impressions across a range of publisher sites targeted to specific users based on factors like their location, browsing behavior, and demographic information. The ultimate goal of a DSP is to increase the efficiency and effectiveness of an advertiser’s digital advertising spend. In the context of mobile advertising, a key revenue driver for DSPs is app installs, often measured as Cost Per Install (CPI).
Given these dynamics, predicting the install rate is not only essential for optimizing an advertiser’s campaign performance but also directly impacts the bid price and ultimately the CPI. When advertisers participate in RTB, they bid for ad impressions based on their estimation of the likelihood that a user will install their app after viewing the ad. A well-calibrated install rate prediction model informs these bidding decisions. If the model overestimates the install rate, advertisers may bid too aggressively, resulting in higher bid prices and inflated CPI. Conversely, underestimating the install rate could lead to missed opportunities. Therefore, striking the right balance between install rate prediction accuracy and bid price optimization is critical for achieving cost-effective campaigns. And, choosing the right metric for developing and evaluating install rate models is of paramount importance.
Binary classification - goals and metrics for installation rate prediction model
Binary Classification is a type of machine learning problem where an observation is classified into one of two classes. Evaluating the performance of a binary classification model is crucial as it provides insights into the areas where the model is doing well and where it needs improvement.
In the context of Real-Time Bidding (RTB), the target of an install rate prediction model is to predict whether a given ad impression will lead to an app install or not. This is a binary classification problem, where the two classes are ‘install’ and ‘no install’. The output of the model can be used to optimize the bidding strategy in real-time, thereby maximizing the return on ad spend.
When evaluating a binary classification problem for the installation rate prediction model, we encounter four possible types of installation outcomes based on the model’s prediction of installation and the actual installation event:
True Positive (TP): TP outcomes occur when the model predicts the app installation (positive prediction class), and the installation happens (positive installation class).
True Negatives (TN): TN outcomes occur when the model predicts no app installation (negative prediction class), and the installation does not happen (negative installation class).
False Positive (FP): FP outcomes occur when the model predicts an installation (positive prediction class), but the actual installation does not happen (negative installation class).
False Negative (FN): FN outcomes occur when the model predicts the no app installation (negative prediction class), but the installation happens anyways (positive installation class).
Based on these outcomes, we can use the following common metrics to measure classification problems:
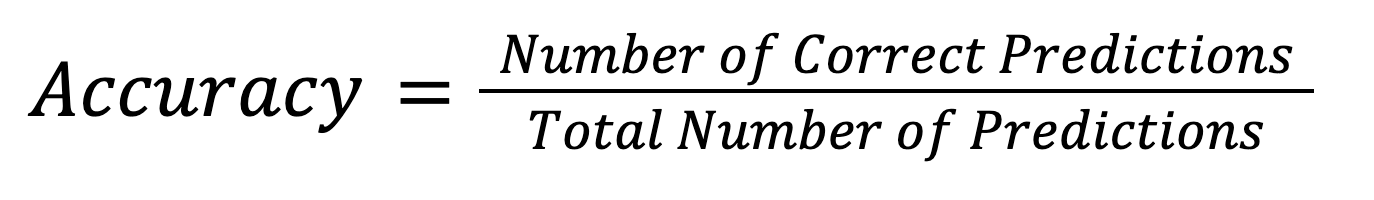
Accuracy: This is the most intuitive performance measure. It is the ratio of correct installation predictions, positive and negative (TP and TN), to the total number of observations. We use the following formula to calculate accuracy:
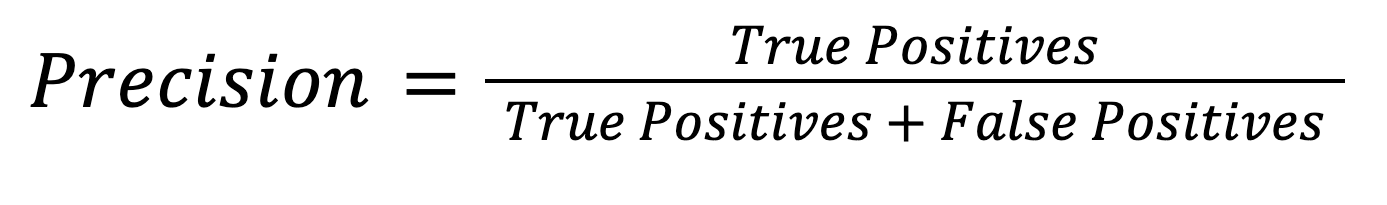
Precision: Precision is the ratio of correctly predicted positive observations (TP) to the total positive predictions (TP and FP). High precision relates to a low false positive rate. We use the following formula to calculate precision:
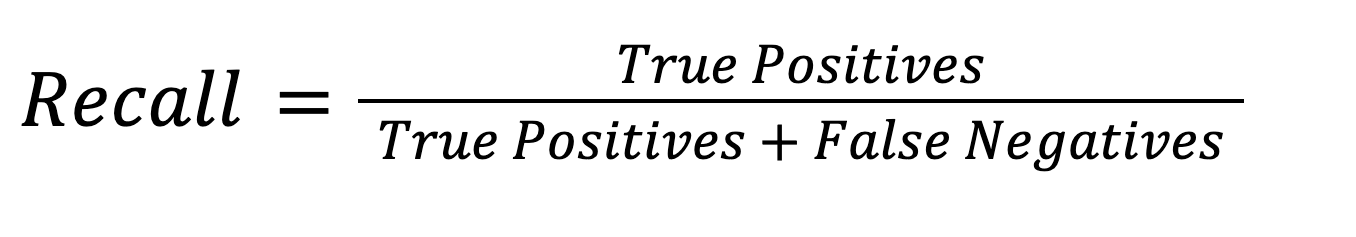
Recall: Recall shows how good the model is at predicting actual installations. Recall is the ratio of correc(positive) predictions to the total number of actual positive installations (TP and FN). We use the following formula to calculate recall:
Each of these metrics provides a different perspective on the performance of the model, and depending on the problem at hand, one metric may be more useful over another.
Install rate prediction with imbalanced data
The main challenge in building an installation prediction model is dealing with imbalanced data. In practice, only a small fraction of ad impressions lead to an app install. The small number of installs can be explained by many reasons related to the user behavior, competition, and the overall app ecosystem. This leads to a situation where the ‘install’ class is significantly outnumbered by the ‘no install’ class. This imbalance can cause the model to be biased towards predicting the majority class, and thus fail to capture the characteristics of the minority class.
Using the PR Curve to account for data imbalance
A naive approach to solving the install rate prediction problem would be to use accuracy as the metric to optimize. Accuracy is a simple and intuitive metric that measures the proportion of correct predictions made by the model. However, when dealing with imbalanced datasets, accuracy can be misleading.
For instance, if only 1% of ad impressions lead to an install, a model that just predicts ‘no install’ for all impressions would still have an accuracy of 99%. This model, while having high accuracy, would be useless for our purposes as it fails to identify any of the actual installs.
This brings us to the Precision-Recall (PR) curve, a more suitable metric for imbalanced classification problems. The PR curve plots the precision (y-axis) against recall (x-axis) for every possible classification threshold. Unlike accuracy, both precision and recall take into account the imbalance between the classes. The area under the PR curve (PR AUC) gives a single number summary of the model performance, with a higher AUC indicating a better model.
In the context of install rate prediction, high precision means that if our model predicts an install, it is very likely to be correct. High recall means that our model is able to correctly identify a high proportion of actual installs. By optimizing the AUC of the PR curve, we aim to maximize both precision and recall, thereby building a model that is both reliable (high precision) and sensitive (high recall) to potential installs. This is crucial for maximizing return on ad spend.
Offline evaluation results
Offline evaluation is a crucial step in the development of machine learning models. It involves testing the model on a holdout dataset that was not used during training. This provides an estimate of how the model might perform on unseen data, which is essential for understanding its generalization ability.
For our installation prediction model, offline evaluation allows us to assess the model’s performance before deploying it in a live bidding environment. This is important because deploying a poorly performing model would lead to suboptimal bidding decisions and a significant waste of ad spend.In addition, waiting for real user feedback from production can be time-consuming. With offline evaluation, we can identify problems and develop new models faster.
In our experiment, we first evaluated our model using accuracy. However, given the imbalanced nature of our dataset, accuracy proved to be a misleading metric. Despite achieving a high accuracy score, our model predicted the majority class and failed to capture the instances of app installs.
Recognizing the limitations of accuracy, we applied the PR AUC as our evaluation metric of the holdout data set. The results were significantly more informative. The PR AUC score gave us a better understanding of the trade-off between precision and recall, and helped us identify a threshold that balanced these two metrics. By optimizing for PR AUC, we were able to improve the sensitivity of our model to potential installs without sacrificing reliability.
Conclusions
Developing a robust install rate prediction model for Real-Time Bidding (RTB) in ad tech involves several key considerations.
- Traditional metrics like accuracy are not suitable for ad tech. Instead, alternative metrics such as the Area Under the Precision-Recall Curve (PR AUC) provides a more nuanced understanding of the model’s performance
- It is crucial to account for data imbalance, as the majority of ad impressions do not lead to installs
- Offline evaluation is important when assessing the model’s performance on unseen data before deployment
By taking these factors into account, we can develop more effective and reliable predictive models for RTB, which can then lead to an increase in revenue.


.webp)
.jpg)